BIOSIGNALS 2011Rome, Italy26–29 January 2011pp. 335–341
Gaze Trajectory as a Biometric Modality
Nine gaze measurements, sampled every 20 milliseconds while a person looked at five photographs, were enough to tell three individuals apart — a first feasibility test of gaze trajectory as a biometric, reported by its authors as preliminary.
Behind this text: two schematic gaze trajectories over one image — authored for illustration, not recorded data. The paper's own figures appear in Results.
What the paper argues
Four moves, in the order the paper makes them.
Identity has to be read off something
Biometric systems establish who someone is from a physical or behavioural characteristic — fingerprint, face, gait. Behavioural modalities work from acquired style: how a person signs, types, or moves a mouse. Every one of them needs the user to do something deliberate, and most need dedicated hardware to capture it.
Nobody had tried looking
Gaze tracking continuously measures the point or direction of a person’s gaze. Its use in biometrics was unexplored: the authors state they were not aware of any studies using gaze as a source of biometric information. Eye behaviour had been studied for what it reveals about emotion, deception, and attention — never for whether it identifies.
Treat a scanpath like a signature
Gaze data closely resembles online signature verification data, except that it is captured against a screen showing fixed stimuli rather than a digitising pad. So: show every user the same five photographs in the same order, record where the eyes go, extract features, and compare against previously stored templates.
A pipeline, and an honest first number
The paper delivers a complete capture-to-classification system and a preliminary error-rate assessment: four classifiers at three training proportions, and three feature-selection algorithms compared against using all nine features. The authors close by stating the sample was very small and more testing is required.
Abstract, as printed
Could everybody be looking at the world in a different way? This paper explores the idea that every individual has a distinctive way of looking at the world and thus it may be possible to identify an individual by how they look at external stimuli. The paper reports on a project to assess the potential for a new biometric modality based on gaze. A gaze tracking system was used to collect gaze information of participants while viewing a series of images for about 5 seconds each. The data collected was firstly analysed to select the best suited features using three different algorithms: the Forward Feature Selection, the Backwards Feature Selection and the Branch and Bound Feature Selection algorithms. The performance of the proposed system was then tested with different amounts of data used for classifier training. From the preliminary experimental results obtained, it can be seen that gaze does have some potential as being used as a biometric modality. The experiments carried out were only done on a very small sample; more testing is required to confirm the preliminary findings of this paper.
Keywords: Biometrics, Gaze tracking.
Why it matters
Every other behavioural biometric asks the user to do something. This one asks them to look at what is already in front of them.
A credential you cannot hand over
Human–computer interaction is itself a source of biometric information, because the way a user interacts with a machine may be quite distinctive. Its attraction is a non-intrusive authentication mechanism: no deliberate action, no extra sensor beyond a camera the device already has. Gaze sits at an unusual place in that space — it is behavioural, shaped by acquired interest and strategy, but also physiological, determined by the tissues and muscles that set the eye’s capabilities and limits.
Where the authors expected it to be useful
- Verification on any device that already contains a camera — smart phones, personal computers.
- Remote authentication for web sites or e-commerce, where no specialised reader can be assumed.
- Liveness detection, driving pupil response with changing illumination or images.
The questionCould everybody be looking at the world in a different way — and if so, can an individual be identified by how they look at external stimuli?
Method
Seven stages from a face in front of a webcam to a classification decision. Select a stage to see what enters it, what it does, what leaves, and what it assumes.
01Initialisation
Detect the face, eyes, and nose, and verify the user is facing the sensor before anything is recorded.
Inputs
- Live webcam frames
- User seated at the display
Processing
- Detect face position
- Locate eye and pupil centres
- Confirm the user is facing the sensor and viewing the scene
Outputs
- A tracked face with pupil centres, or a failure to proceed
All pipeline stages
01 Initialisation
Detect the face, eyes, and nose, and verify the user is facing the sensor before anything is recorded.
- Inputs
- Live webcam frames; User seated at the display
- Processing
- Detect face position; Locate eye and pupil centres; Confirm the user is facing the sensor and viewing the scene
- Outputs
- A tracked face with pupil centres, or a failure to proceed
- Assumptions
- The user remains within the sensor’s working range for the whole session.
- Reported
- Viewing distance: 30–60 cm; Rig: Table-mounted, camera centred below screen
02 Calibration
Nine dots, shown one at a time, map pupil position onto screen position for this user in this session.
- Inputs
- Tracked pupil centres
- Processing
- Present 9 calibration dots, one location at a time; Hold each dot while the user fixes their gaze on it; Store the mapping from pupil location to screen location
- Outputs
- Per-session calibration data used to estimate the gaze point
- Assumptions
- The mapping captured at calibration holds for the rest of the session.
- Reported
- Calibration points: 9; Dwell per point: 5 s (5000 ms)
03 Stimulus presentation
Five photographs, five seconds each, full-screen, with a grey rest screen and a centre fixation between them.
- Inputs
- Five images drawn from published image-quality databases; A calibrated session
- Processing
- Display the application full-screen and modal, so nothing else is visible; Show each image for 5 s; Grey the screen between images and ask the user to fixate the centre; Repeat: two capture sessions per image set
- Outputs
- A controlled, repeatable viewing sequence identical for every user
- Assumptions
- The images are all assumed to be of the same quality, so gaze is not influenced by image quality. Alternating images of objects, nature, and people avoids gaze being influenced by any one kind of content. Starting every image from a centre fixation makes trajectories comparable across users and sessions. Two sessions per image set are required because gaze depends on the task being carried out.
- Reported
- Images: 5; Display time: 5 s each; Rest period: 3 s (3000 ms); Sessions per image set: 2
04 Gaze capture
Every frame writes sixteen raw fields — both pupils, their sizes, tracking status, the estimated gaze point, and interocular distance.
- Inputs
- Calibrated tracking; The stimulus currently on screen
- Processing
- Record one row per frame from the gaze sensor; Tag each row with the stimulus being presented
- Outputs
- A raw gaze record with enough information to support later feature extraction
- Assumptions
- The user is not distracted by anything outside the application, which runs modal and full-screen.
- Reported
- Raw fields per frame: 16; Fields: Frame number, time, interval, L/R pupil x and y, L/R tracking status, data type, L/R pupil size, stimulus, gaze point x and y, interocular distance
05 Feature extraction
Nine of the sixteen fields become the feature vector, sampled every 20 milliseconds and concatenated across all five images.
- Inputs
- Raw gaze records
- Processing
- Extract nine feature elements every 20 ms while each image is displayed; Form a feature vector per sub-image; Concatenate across the five images into one vector per capture session
- Outputs
- One 11,250-element feature vector per capture session
- Assumptions
- A fixed 20 ms sampling interval represents the trajectory adequately for classification.
- Reported
- Features: 9; Sampling interval: 20 ms; Samples per image: 250; Vector length: 9 × 250 × 5 = 11,250
06 Feature selection
Three algorithms search for the subset of the nine features that classifies best, measured against using all nine.
- Inputs
- Feature vectors from every capture session
- Processing
- Forward Feature Selection (FFS); Backwards Feature Selection (BFS); Branch and Bound (B&B); Compare each against a control that uses all features
- Outputs
- A ranked subset of features per algorithm
- Assumptions
- The control — all nine features — is the baseline any subset must beat.
- Reported
- Subset sizes evaluated: 2 to 8 features; Best subset size: 7 features (BFS and B&B)
07 Classification
Four classifiers compare a capture session against stored templates, retrained at three different training proportions.
- Inputs
- Selected feature vectors; Stored templates from enrolment
- Processing
- K-Nearest Neighbour (KNNC); Support Vector Classifier (SVC); Normal Densities-based Linear Classifier (LDC); Fisher Minimum Least Square Linear Classifier (FISHERC)
- Outputs
- An error rate per classifier per training proportion
- Assumptions
- Error rates are reported as single figures, without confidence intervals or repetition counts.
- Reported
- Classifiers: 4; Training proportions: 20%, 50%, 80%; Corpus: 3 individuals × 3 samples
Results
Two measurements: how error rate varies with classifier and training proportion, and whether selecting a subset of the nine features beat using all of them.
Error rate by classifier and training proportion
n = 3The experiment was carried out with 3 individuals, and 3 samples were collected from each — nine capture sessions in total.
Table 3, as reported
| Classifier | 20% training | 50% training | 80% training |
|---|---|---|---|
| KNNCK-Nearest Neighbour | 0.152 | 0.064 | 0.030 |
| SVCSupport Vector Classifier | 0.077 | 0.004 | 0.010 |
| LDCNormal Densities-based Linear Classifier | 0.077 | 0.004 | 0.010 |
| FISHERCFisher Minimum Least Square Linear Classifier | 0.005 | 0.004 | 0.000 |
What the numbers say
- K-Nearest Neighbour is the only classifier whose error falls consistently as training data grows — 0.152 at 20%, 0.064 at 50%, 0.030 at 80%. It is also the weakest at every proportion.
- The Support Vector Classifier and the linear classifier report identical error rates at all three proportions. The paper does not comment on why.
- Fisher’s linear classifier reports the lowest error at every proportion, and reaches 0.000 at 80% training. On a corpus of nine capture sessions, a zero is the absence of a counter-example, not a measurement of accuracy.
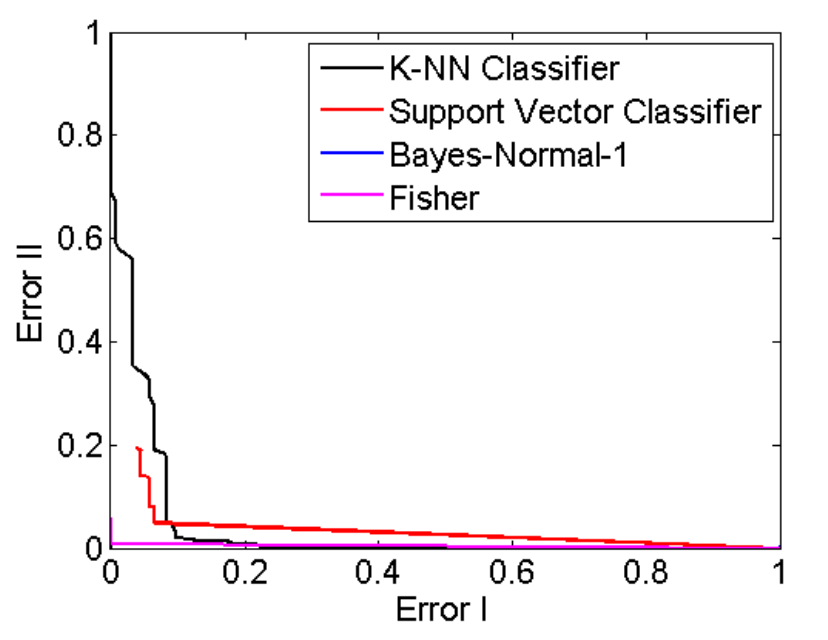
Figure 4: ROC curve with 20% of data as Training data.
The K-NN trace climbs steeply on the left — it pays a large Error II penalty before Error I falls. The Fisher and Bayes-Normal traces sit flat along the bottom axis across the whole range, which is what the tabulated error rates say in another form.
Which features survived selection
| 1Duration | 1 | 2 |
|---|---|---|
| 2Left pupil x | 2 | 4 |
| 3Left pupil y | — | 7 |
| 4Right pupil x | 3 | — |
| 5Right pupil y | 4 | 5 |
| 6Left pupil size | 5 | 1 |
| 7Right pupil size | 6 | — |
| 8Gaze point x | — | 6 |
| 9Gaze point y | 7 | 3 |
Cells carry the performance ranking each algorithm assigned; brighter is higher-ranked. A dash means the algorithm dropped that feature. Both algorithms converged on seven of the nine features — the subset size that performed best — but not the same seven, and not in the same order.
What feature selection bought
- Selecting only 2 to 3 features did not improve performance. At 4 features there was a slight improvement. Between 5 and 7 features the selected subsets improved on the control.
- At 8 features, FFS gave only slight improvement, while BFS and B&B matched the control that used all features — the selection had stopped buying anything.
- The best performance came from BFS and B&B with 7 of the 9 features selected.
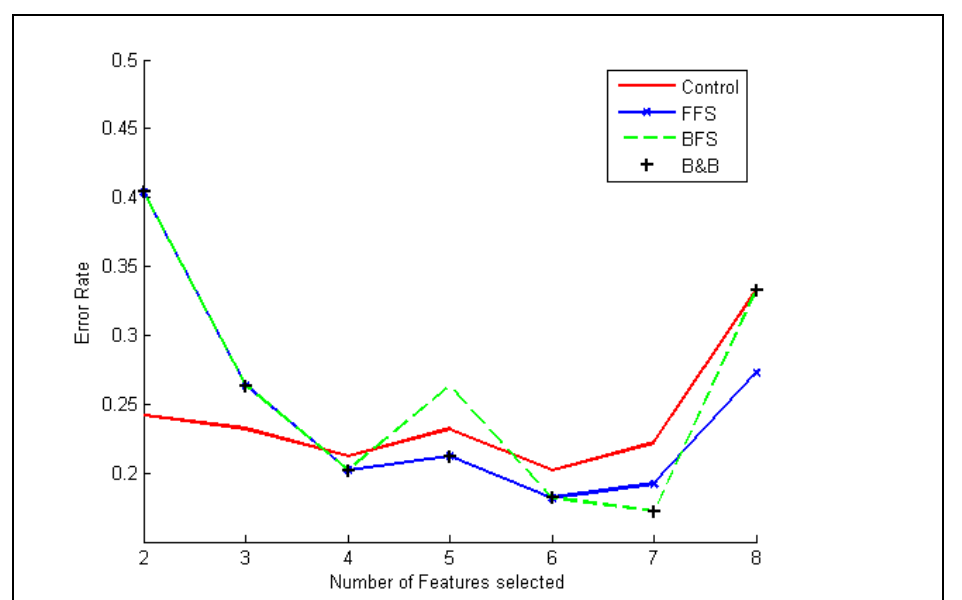
Figure 5: Error rate before and after feature selection.
The control line — all nine features — runs nearly flat around 0.20 to 0.24. The selection algorithms start worse at two features, cross the control at four, and stay below it from five to seven. At eight features every trace turns sharply upward.
How far these numbers carry
- The experiment was carried out with 3 individuals, and 3 samples were collected from each — nine capture sessions in total.
- No confidence intervals, variance, or repetition counts are reported for any error rate, so differences of a few thousandths between classifiers cannot be distinguished from noise.
- With three enrolled identities, chance-level performance is already high; the figures show separability within this corpus, not a false-accept rate that would transfer to a deployed system.
- The paper states its own verdict plainly: the experiments were only done on a very small sample, and more testing is required to confirm the preliminary findings.
Against the neighbours
The behavioural modalities this work sits beside, with what each reported and on how many people.
The paper positions gaze against the behavioural modalities it most resembles — the ones it reviews in its own background section. Two things are worth reading across this table: what each modality asks of the user, and how many people it was evaluated on.
| Modality | Work | Reported | Participants | Relation to this paper |
|---|---|---|---|---|
| Gaze trajectorythis paper | This paper (2011) | Error rates 0.000–0.152 depending on classifier and training split | 3 individuals, 3 samples each | Requires no deliberate action at all — the user only looks at what is already on screen. |
| Online signature verification | Lei & Govindaraju (2005); Chapran et al. (2008) | FAR, FRR, and EER computed per feature to find the most consistent features | Not stated in this paper | The closest analogue, and the model for the approach: gaze data is very similar to online signature data, except it is captured against a screen rather than a digitising pad. |
| Mouse dynamics | Revett et al. (2008) | FAR 2%–6%, FRR 0%–7% | 5 users | The nearest point of comparison on evidence base — a preliminary result at a similar scale, which is how this field’s HCI modalities tend to begin. |
| Keystroke dynamics | Monrose & Rubin (2000) | Timing between keystrokes, duration, finger placement, applied pressure | Not stated in this paper | Offers the static-versus-continuous distinction this work inherits: continuous monitoring can catch an imposter substituted after login, static cannot. |
| Gaze tracking accuracy (not biometrics) | Chao-Ning Chan et al. (2007) | 85%–96% accuracy within 2 metres | Not stated in this paper | A ceiling on the input, not a competing modality: whatever a gaze biometric achieves is bounded by how well the gaze point can be measured in the first place. |
The internal baseline is the control in Figure 5 — the same pipeline using all nine features without selection. Every claim about feature selection in this paper is measured against that line, not against another system.
Limitations and ethics
What the paper says about its own reach, and what a reader in 2026 should add to it.
Limitations
Three people
From the paperThe experiment was carried out with 3 individuals and 3 samples were collected from each. Nine capture sessions is not a corpus from which error rates generalise, and the paper does not present it as one.
The authors’ own verdict
From the paperFrom the preliminary results obtained, gaze information may have some potential for being used as a biometric modality. The experiments carried out were only done on a very small sample; more testing is required to confirm the preliminary findings of this project.
Accuracy is bounded by the tracker
From the paperFuture research on this topic should be directed at increasing the overall accuracy of the gaze tracking system. The measurement chain in front of the classifier was, in 2011, the limiting component.
No error bars, so read the order not the gap
Added on this pageEach figure in Table 3 is a single number with no reported variance or repetition count. The ranking of classifiers is the readable signal; the distance between 0.004 and 0.005 is not.
Fixed stimuli, fixed order
Added on this pageEvery user saw the same five images in the same sequence. Whether a template survives a change of stimulus set — the question any deployment would ask first — is outside what this experiment tested.
Ethics
Non-intrusive cuts both ways
Added on this pageThe property that makes gaze attractive — that it needs no deliberate action from the user — is also what makes it collectable without the user registering that anything was collected. A modality that requires no gesture provides no moment at which consent is naturally sought.
A gaze template is a record of attention
Added on this pageThe stored features are not an abstract key. They encode where a person looked, for how long, and how their pupils responded — the same measurements the paper’s own background section cites as indicators of emotion, sadness processing, and deception. An identity template built from them carries more than identity.
The paper does not address this
Added on this pageThis section is commentary added for this page, not a summary of the paper. The 2011 paper contains no ethics statement, no consent protocol, and no data-protection discussion — which was ordinary for a short feasibility paper of its era, and is worth stating rather than glossing.
Reproducibility
What was released, what was only described, and how to cite the work.
Gaze dataset
Not releasedNo gaze corpus was released with the paper. The nine capture sessions described in Section 4 are not publicly available.
Stimulus images
Described onlyThe five stimulus images were obtained from published image-quality databases: Engelke, Maeder & Zepernick (2009), and the Le Callet & Autrusseau (2005) IRCCyN/IVC subjective quality database. The paper does not identify which five.
Source code
Not releasedNo implementation was released. The classifier set — KNNC, SVC, LDC, FISHERC — and the three selection algorithms are named in the paper but not accompanied by code.
Experimental procedure
Described onlyThe test procedure is based on Duchowski (2007), Judd et al. (2009), and Van et al. (2009). Rig geometry, timings, and the full field and feature lists are specified in the paper and reproduced in the methods section above.
Citation
AvailableDeravi, F., & Guness, S. P. (2011). Gaze Trajectory as a Biometric Modality. BIOSIGNALS 2011, 335–341. SCITEPRESS.
Contact
AvailableThe addresses printed in the paper are 2011 University of Kent accounts. For correspondence about this work now, use the addresses on the main site.
BibTeX
@inproceedings{deravi2011gaze,
  author    = {Deravi, Farzin and Guness, Shivanand P.},
  title     = {Gaze Trajectory as a Biometric Modality},
  booktitle = {Proceedings of the International Conference on
               Bio-inspired Systems and Signal Processing (BIOSIGNALS 2011)},
  year      = {2011},
  pages     = {335--341},
  address   = {Rome, Italy},
  publisher = {SCITEPRESS},
  isbn      = {978-989-8425-35-5},
  doi       = {10.5220/0003275803350341}
}
References
18 works cited in the paper.
- [1]Adolphs, R. (2006). A landmark study finds that when we look at sad faces, the size of the pupil we look at influences the size of our own pupil. Social Cognitive and Affective Neuroscience, 1(1), 3–4. doi.org/10.1093/scan/nsl011
- [2]Castelhano, M. S., Mack, M. L., & Henderson, J. M. (2009). Viewing task influences eye movement control during active scene perception. Journal of Vision, 9(3). doi.org/10.1167/9.3.6
- [3]Castelhano, M. S., Wieth, M., & Henderson, J. M. (2008). I see what you see: Eye movements in real-world scenes are affected by perceived direction of gaze, 251–262. doi.org/10.1007/978-3-540-77343-6_16
- [4]Chao-Ning Chan, Oe, S., & Chern-Sheng Lin. (2007). Active eye-tracking system by using quad PTZ cameras. IECON 2007, 33rd Annual Conference of the IEEE Industrial Electronics Society, 2389–2394.
- [5]Chapran, J., Fairhurst, M. C., Guest, R. M., & Ujam, C. (2008). Task-related population characteristics in handwriting analysis. IET Computer Vision, 2(2), 75–87.
- [6]Duchowski, A. T. (2007). Eye tracking methodology: Theory and practice. Secaucus, NJ, USA: Springer-Verlag New York, Inc.
- [7]Engelke, U., Maeder, A., & Zepernick, H.-J. (2009). Visual attention modelling for subjective image quality databases. Rio de Janeiro.
- [8]Goudelis, G., Tefas, A., & Pitas, I. (2009). Emerging biometric modalities: A survey. Journal on Multimodal User Interfaces, 1–19. doi.org/10.1007/s12193-009-0020-x
- [9]Gutiérrez-García, J. O., Ramos-Corchado, F. F., & Unger, H. (2007). User authentication via mouse biometrics and the usage of graphic user interfaces: An application approach. SAM’07, Las Vegas, NV, 76–82.
- [10]Harrison, N. A., Singer, T., Rotshtein, P., Dolan, R. J., & Critchley, H. D. (2006). Pupillary contagion: Central mechanisms engaged in sadness processing. Social Cognitive and Affective Neuroscience, 1(1), 5–17. doi.org/10.1093/scan/nsl006
- [11]Judd, T., Ehinger, K., Durand, F., & Torralba, A. (2009). Learning to predict where humans look. IEEE International Conference on Computer Vision (ICCV).
- [12]Le Callet, P., & Autrusseau, F. (2005). Subjective quality assessment IRCCyN/IVC database.
- [13]Lei, H., & Govindaraju, V. (2005). A comparative study on the consistency of features in on-line signature verification. Pattern Recognition Letters, 26(15), 2483–2489. doi.org/10.1016/j.patrec.2005.05.005
- [14]Monrose, F., & Rubin, A. D. (2000). Keystroke dynamics as a biometric for authentication. Future Generation Computer Systems, 16(4), 351–359. doi.org/10.1016/S0167-739X(99)00059-X
- [15]Revett, K., Jahankhani, H., Magalhães, S. T., & Santos, H. M. D. (2008). A survey of user authentication based on mouse dynamics. In Global E-security (pp. 210–219). Springer Berlin Heidelberg.
- [16]Van, D. L., Rajashekar, U., Bovik, A. C., & Cormack, L. K. (2009). DOVES: A database of visual eye movements. Spatial Vision, 22(2), 161–177. doi.org/10.1163/156856809787465636
- [17]Wang, J. T., Spezio, M., & Camerer, C. F. (2010). Pinocchio’s pupil: Using eyetracking and pupil dilation to understand truth telling and deception in sender-receiver games.
- [18]Yampolskiy, R. V. (2007). Human computer interaction based intrusion detection. ITNG ’07, Fourth International Conference on Information Technology, 837–842.